Dubious distinctions for Singapore

Singapore private homes still most expensive in Asia-Pacific; HDB flats most attainable: Report​

yaohui-pixgeneric-1687.jpg

The median price of Singapore private homes stood at $1.7 million in 2023. ST PHOTO: LIM YAOHUI
isabelle%20Byline%20Template.png

Isabelle Liew

May 22, 2024

SINGAPORE – Private residential homes in Singapore continue to be the most expensive in the Asia-Pacific for the second year in a row, according to a report by the Urban Land Institute (ULI) released on May 21.
ULI said the median price of Singapore’s private homes stood at US$1.3 million (S$1.7 million) in 2023, the most expensive out of the 48 cities in 11 countries that the report studied.
It was followed by Hong Kong, which recorded an average home price of US$1.15 million. Homes in Sydney, the next highest market, had a median price of US$1.06 million.
However, the report also ranked public housing in Singapore as the “most attainable” in terms of home ownership in 2023. It noted that the country has a home ownership rate of nearly 90 per cent.
Home ownership is considered affordable when the ratio of the median home price to median annual household income is below 5.
The median price of Housing Board flats, which form 90 per cent of the total housing stock in Singapore, has a ratio of 4.7, it said.
In 2023, private home prices in Singapore rose 7 per cent despite property cooling measures implemented in April that year – when additional buyer’s stamp duty (ABSD) rates were raised and loan-to-value ratios were tightened, the report said.

It noted that demand from foreigners fell significantly as the ABSD rate was doubled from 30 per cent to 60 per cent, which contributed to a 20 per cent drop in total home sales.
In terms of price per square metre, however, Hong Kong was the most costly private housing market in the region with an average price of US$18,331 per sq m, or US$1,703 per sq ft.
This was followed by Singapore private homes, which had a median of US$11,749 per sq m, and Shenzhen in China with an average of US$10,142 per sq m.

Homes in Shenzhen had the highest price-to-income ratio of 32.3, followed by Beijing at 28.7. It was around 25 for Metro Manila, Ho Chi Minh City and Hong Kong. In Singapore, the ratio for private homes was 13.5.
Across the cities tracked by ULI, median annual household income was highest in Singapore at US$97,124. The median price of an HDB flat in 2023 was US$461,289, up from US$409,000 in 2022.
Renting is generally “significantly more affordable” than buying a home in the region, said the report.
For example, in Tokyo, where the price-to-income ratio for a home purchase was 14.3, the median monthly rent was 20 per cent of the median monthly household income. The ratio was below 30 per cent for mainland Chinese cities such as Chongqing and Tianjin.
In comparison, it was 36 per cent for private homes in Singapore.

The report showed that rent for two-bedroom private apartments in Singapore was the most expensive, with a median monthly rent of US$2,897.
This overtook Hong Kong (US$1,725), as well as other high-cost-of-living cities like Tokyo (US$613) and Seoul (US$677).
The report also noted a move by the Singapore Government to sell a plot of land to pilot a new class of long-stay serviced apartments, in contrast with its housing policy, which largely centres on home ownership.
“This unusual move was made after the Urban Redevelopment Authority determined that there is sufficient demand for long-term rental housing, especially among young professionals, students and families in transition, following consultations with the industry,” the report said.
In April, a Government Land Sales site in Zion Road was awarded to a City Developments-Mitsui Fudosan joint venture for $1.1 billion.
The joint venture will explore a mixed-use project with 740 residential units for sale and 290 rental apartments, The Straits Times reported in April.
Another site in Upper Thomson, an integrated development with Springleaf MRT station that analysts said could yield 640 units, including 100 rental apartments, was launched for sale in December 2023.
The tender for the plot will close in June 2024.
The ULI report said that China, Australia and Bangkok have similar rental housing initiatives.
Many many new kampongers wet wet on SG BTO Overnight Millionaires Dream
1000028787.jpg
 

Singapore ranked second most expensive city for expats by Mercer​

yaohui-pixgeneric-2170.jpg

High rental costs saw Hong Kong and Singapore beating Swiss cities to the top of the list of most expensive cities for expats. PHOTO: ST FILE

Jun 18, 2024

HONG KONG – Regional finance hubs Hong Kong and Singapore have topped a global list of the world’s most expensive cities for expatriates, keeping Swiss destinations from the top spots for the second year in a row.
High rental costs saw Hong Kong beat Zurich, Geneva, Basel and Bern to the top of the table, with Singapore taking second place, according to Mercer’s 2024 Cost of Living report.
New York fell one spot to land in seventh place. London took eighth place, rising nine spots since last year’s ranking.
Mercer’s report said rising housing costs and “volatile inflation trends” were putting pressure on expat workers’ compensation packages.
“Cost-of-living challenges have had a significant impact on multinational organisations and their employees,” Mercer’s global mobility leader Yvonne Traber said in a press release.
“High living costs may cause assignees to adjust their lifestyle, cut back on discretionary spending or even struggle to meet their basic needs,” she said. “To offset these challenges, employers can offer compensation packages that include housing allowances or subsidies or provide other support services.”
Elsewhere on the list:
  • Seven US cities made it to the top 20 list, including Los Angeles (10th spot), Honolulu (12th) and San Francisco (13th).
  • Sydney was the Pacific region’s costliest place (58th).
  • Toronto was Canada’s most expensive city (92nd).
  • Mumbai was India’s priciest destination (136th).
  • Nigeria’s Lagos (225th) and Abuja (226th) tumbled to the bottom of the table due to currency fluctuations.
Mercer measured the comparative cost of more than 200 items and services – including housing, transport, food, clothing and household goods – to come up with its ranking of 226 cities.
These are Mercer’s top 10 most expensive cities for expats:
  1. Hong Kong
  2. Singapore
  3. Zurich
  4. Geneva
  5. Basel
  6. Bern
  7. New York
  8. London
  9. Nassau
  10. Los Angeles
BLOOMBERG
 
Top spot means the workers are being worked too hard, the students are being pushed too hard, and the citizens are too stressed?

S’pore reclaims top spot in world competitiveness ranking after three years​

Azmi-pixgeneric-2.jpg

Singapore posted robust performances across all four categories in the World Competitiveness Ranking. PHOTO: ST FILE
ac_bylineColin%20%281%29_0.png

Colin Tan
Senior Business Correspondent
Jun 18, 2024

SINGAPORE – After being adrift for the past three years, Singapore climbed three rungs and regained the top spot in the IMD World Competitiveness Ranking in 2024 against a field of 67.
“Singapore’s performance marks a return to form; last occupying first place in 2020, it then fell to fifth, third, and finally fourth in the following years, while Denmark and Switzerland performed a tussle for power over the top spot,” said the Switzerland-based International Institute for Management Development (IMD), which produces the benchmark based on 333 competitiveness criteria.
Coming in ahead of Switzerland and Denmark, the Republic posted robust performances across all four categories that comprise economic performance, government efficiency, business efficiency and infrastructure.
Among these, Singapore stood out for business efficiency by clinching the top spot among its peers on the index for the underlying factors of labour market – up three spots – and attitudes and values with a 12-position climb. It also shot up 21 rungs to the No. 2 spot in terms of management practices.
The Republic also took pole position in technological infrastructure, boosting its standing to No. 4 in the overall infrastructure category, from No. 9 previously.
It ranked No. 2 in terms of government efficiency after climbing five spots from seventh place, boosted by societal framework (up nine spots to No. 11) and public finance (up five to No. 4).
On the flip side, the Republic’s economic performance stagnated at No. 3, dragged down by an 11-rung decline by prices to 62, and a three-spot fall in employment to No. 5.

Associate Professor Jamus Lim from Essec Business School noted that Singapore’s traditional strengths lie in “an efficient government, ease of doing business, and world-class infrastructure also continued to propel its overall performance”.
However, he said the high costs of living here is specifically an area of concern, “where Singapore placed 62nd out of the 67”.
“Many other areas where Singapore exhibits weaknesses – such as rental prices, cost of transport, compensation of management and employees, and health expenditures – are directly or indirectly linked to it,” Prof Lim said.

“This becomes the primary challenge for policymakers, not only because high prices and costs weigh on Singapore’s competitiveness, but also because of its implications on people’s confidence in the economy.”
On Singapore’s high prices, NUS Business School professor in strategy and policy Lawrence Loh said: “This is expected of a land-scarce country.”
With price levels just one of the inevitable constraints on the economy and with regional economies relentlessly continuing to advance and narrow the Republic’s lead, “Singapore cannot rest on its laurels”, he added.
IMD’s ranking analysed survey responses from more than 6,600 C-suite executives and mid-level managers from the 67 economies polled between March and May 2024, and 164 pieces of statistical data.


A key finding was that size did not matter in economic competitiveness, with the top 10 spots dominated by smaller economies.
Notably, second-placed Switzerland rose one rank from its third placing in 2023 amid better economic performance and business efficiency as well as its continued lead in government efficiency and infrastructure.
It was followed by Denmark, which slipped to third in 2024, down from first following a decline in economic performance, but researchers said the shift was “insignificant” as the country remained a poster child of competitive economies.
Ireland was No. 2 in 2023, but fell to fourth spot in 2024.
NUS’ Prof Loh noted that Singapore stood out on sub-factors “related to policy and cultural aspects”. For example, Singapore’s labour market shines in aspects such as remuneration management, worker participation and foreign talent attraction, he said.
“The country also does extremely well in terms of attitudes and values, which include accommodating views on globalisation, flexibility and adaptability, along with a value system that supports competitiveness.”
Prof Lim noted: “Wage growth has barely kept pace with overall inflation, and if anything, I would like to see real wages continue to rise this year and next, to offset the loss in purchasing power of the population.
“But productivity needs to pick up the slack, hopefully from gains that emerge from a wider roll-out of artificial intelligence into the economy.”
He cautioned that the takeaway from this report should not be to conclude that the solution to keeping costs down is by suppressing wages.
 
Top spot means the workers are being worked too hard, the students are being pushed too hard, and the citizens are too stressed?

To the technocrats, you are nothing more than human resource. Less human, more resource.

They don't get a squirrel's arse about your so-called well being.
 

Singapore, Hong Kong are costliest cities for luxury spending: Report​

yaohui-pixgeneric-1905.jpg

Singapore has continued to attract the ultra-wealthy by maintaining its reputation for political and economic stability, alongside a pro-business environment. PHOTO: ST FILE

Jun 25, 2024

Singapore remains the most expensive city in the world for spending on luxury goods, such as jewellery and shoes, and services including dining, healthcare and education.
Rival Hong Kong climbed one spot from 2023 to second, while London rose one place to third, according to an annual report by Swiss wealth manager Julius Baer Group.
Singapore has continued to attract the ultra-wealthy by maintaining its reputation for political and economic stability, alongside a pro-business environment. Hong Kong is the most expensive city for engaging a lawyer and the second most for buying property.
London rose partly on the strength of the British pound and “some normalisation” post-Brexit. Meanwhile, Shanghai dropped to fourth, likely due to challenges in the real estate market and softening consumer confidence, the report said.
Tokyo plummeted to 23rd due to the weakening yen. Many of the biggest changes in the index are due to currency fluctuations as index prices are converted to US dollars for global comparison, the report said.
Santiago in Chile is now a more expensive place to live than Tokyo in US-dollar terms – a situation that would once have been “unimaginable”, the report said.
Zurich climbed to sixth and was the year’s biggest gainer, largely due to the strength of the Swiss franc.

Julius Baer’s Lifestyle Index ranks the world’s 25 most expensive cities by analysing residential property, cars, business-class flights, school, degustation dinners and other luxuries. The bank surveyed high-net-worth individuals with bankable household assets of US$1 million (S$1.35 million) or more from February to March 2024.
Europe, the Middle East and Africa went from being the most affordable region in 2023 to the most expensive, with “significant price increases” and every European city moving up the rankings. Strong exchange rates prompted a change in the region’s fortunes.
There are “pockets of affordability” though, according to the report. The region is the cheapest place to buy champagne and whisky. France is home to the Champagne region and Scotland boasts more distilleries than anywhere else, the report said.
Dubai dropped to 12th from seventh place in 2023. While Singapore and Hong Kong took the top spots, other Asian cities, notably Tokyo, Bangkok and Jakarta, fell in the rankings.
In Singapore, wealthy individuals are favouring “discreet over more overt expressions of wealth”, with sales of watches, cars, apartments and other luxury goods dropping.
There was also a slight 0.46 per cent decline in the average price of luxury goods year on year in Singapore-dollar terms, the report noted.
Prices in the Republic fell the most in Singapore dollars for bicycles (25.2 per cent), business-class flights (18.4 per cent) and whisky (16.2 per cent).
Conversely, prices climbed the most for cars (13.4 per cent), private schools (12.4 per cent), women’s handbags (10.3 per cent) and women’s shoes (9.1 per cent).
Globally, price increases slowed to 4 per cent from 6 per cent in 2023 across the index of goods and services in US-dollar terms.
The cost of bicycles fell almost everywhere, almost certainly down to the glut of bikes after the Covid-19 pandemic, while others with price falls included business-class flights, with travel returning to normal after post-pandemic demand sent prices skyrocketing, the report said. Jewellery, women’s shoes and men’s suits showed the biggest gains. BLOOMBERG
 
Makes the Singapore passport more attractive to forgery.

Singapore passport reclaims sole position as world’s most powerful, after sharing title with 5 others​

IMGL9516.JPG

Singapore citizens have visa-free entry to 195 out of 227 travel destinations. PHOTO: LIANHE ZAOBAO FILE
sarahkoh.png

Sarah Koh

Jul 24, 2024

SINGAPORE – The Republic has trumped five other countries to become the only one in the top spot in a world ranking of passports, with Singaporeans now enjoying visa-free entry to 195 out of 227 travel destinations.
According to the latest data published by the Henley Passport Index on July 23, the five countries – France, Germany, Italy, Japan and Spain – have dropped to second place, with visa-free entry to 192 destinations.
These countries and Singapore previously shared the top spot with visa-free entry to 194 out of 227 travel destinations, according to rankings published by Henley in January 2024.
The index includes 199 passports and 227 travel destinations.
In the latest rankings, an “unprecedented seven-nation cohort” occupies third spot with access to 191 destinations without a visa.
The countries are Austria, Finland, Ireland, Luxembourg, the Netherlands, South Korea and Sweden.
Former passport powerhouses Britain and the US have slid down the list since 2014, when they shared the joint top spot on the index.


Britain is fourth with 190 destinations, sharing the spot with Belgium, Denmark, New Zealand, Norway and Switzerland. The US is eighth, with visa-free entry to 186 destinations.
Afghanistan’s passport retains its position as the world’s weakest, with its citizens having access to 26 countries visa-free. The country lost visa-free access to one destination in the past six months, leaving it with the lowest score ever recorded since the index was created 19 years ago.
The Henley Passport Index is based on exclusive data from the International Air Transport Association.
The general trend over the past two decades has been towards greater travel freedom, said Dr Christian Kaelin, chairman of Henley & Partners, and creator of the passport index concept.
The global average number of destinations that travellers are able to access visa-free has nearly doubled from 58 in 2006 to 111 in 2024.
“However, the global mobility gap between those at the top and bottom of the index is now wider than it has ever been, with top-ranked Singapore able to access a record-breaking 169 more destinations visa-free than Afghanistan,” said Dr Kaelin.
The United Arab Emirates made it into the top 10 for the first time, with visa-free entry to 185 destinations, after having added 152 destinations to its portfolio since the index was created.
 
This makes Singapore a major money-laundering hub as well as the most expensive city in the world.

Singapore places fourth in world financial centres ranking, ahead of San Francisco, Shanghai​

eloil17.341d1d37.Attachment.073257_0.jpg

Singapore placed fourth in a ranking system that evaluates the competitiveness of financial centres around the world. ST PHOTO: GIN TAY


Sep 25, 2024

Singapore placed fourth in a ranking system that evaluates the competitiveness of financial centres around the world, trouncing other cities including San Francisco, Shanghai and Geneva.
New York and London took the top two spots in the latest Global Financial Centres Index released on Sept 23. Hong Kong ranked third, reclaiming the position of Asia’s top financial centre from Singapore, which had held the spot for the last four editions of the index.
It is good news for Hong Kong’s finance sector, which was battered by pandemic restrictions that prompted many workers to leave the city. The property market, which has failed to recover, has slowed activity and consumer demand. The government is betting that its initiatives and lower interest rates may revive economic activity.
Dublin, Chicago and Dubai moved up in the rankings, while Shanghai, Beijing and Geneva moved down.
The index, compiled twice-yearly by London-based think-tank Z/Yen Partners and Shenzhen-based think-tank China Development Institute, assesses 121 financial centres using data and survey results from thousands of financial services professionals responding to an online questionnaire.
The latest report noted that 58 locations fell in the rankings, while 46 improved. It also highlighted geopolitical challenges as the most pressing risk, being mentioned by more than one-fifth of respondents.

Here are the top 20 financial centres:​

  1. New York
  2. London
  3. Hong Kong
  4. Singapore
  5. San Francisco
  6. Chicago
  7. Los Angeles
  8. Shanghai
  9. Shenzhen
  10. Frankfurt
  11. Seoul
  12. Washington DC
  13. Geneva
  14. Dublin
  15. Paris
  16. Dubai
  17. Zurich
  18. Beijing
  19. Luxembourg
  20. Tokyo
BLOOMBERG
 
How much reserves is enough?
By not spending more of the reserves now, the PAP government is depriving the current generation of its share of national wealth, and is instead saving the reserves for future generations.

Abu Dhabi tops trillion-dollar sovereign wealth league, ahead of Oslo and Singapore​

2024-09-23T135708Z138835546RC22H3AU984TRTRMADP3GENERAL-ATLANTIC-ABU-DHABI.JPG

Abu Dhabi’s funds include multiple entities, such as the Abu Dhabi Investment Authority, Mubadala Investment Company, and ADQ. PHOTO: REUTERS
Renald Yeo

Oct 09, 2024

SINGAPORE – Abu Dhabi has claimed the top spot in a new global ranking of cities based on the capital managed by their sovereign wealth funds, with US$1.7 trillion (S$2.2 trillion) in assets as at October.
This positions the United Arab Emirates’ capital as the largest hub for sovereign fund capital, according to a report released by Global SWF on Oct 8.
The ranking – which for the first time assesses sovereign fund assets at the city level – places Abu Dhabi ahead of Oslo, Beijing and Singapore.
Singapore, home to GIC and investment company Temasek, ranks fourth, managing over US$1.1 trillion in such assets. The Singapore Government does not publicly disclose the full size of its reserves managed by GIC.
The report noted that Abu Dhabi’s funds include multiple entities, such as the Abu Dhabi Investment Authority (Adia), Mubadala Investment Company and ADQ.
These funds are managed under separate mandates, allowing the city to maintain distinct investment strategies, the report said.
Combined, the three institutions have invested US$36 billion globally in the first three quarters of 2024, accounting for 26 per cent of all sovereign fund investments in that period.

“Sustained high oil prices have meant healthy fiscal surpluses for Abu Dhabi since 2020, when it experienced its last stress test,” the report noted.
“According to Fitch’s forecasts, if things stay the way they are, the emirate will benefit from US$60 billion in surplus in the next two years – which would flow into the already massive Adia.”
Apart from its financial assets, Abu Dhabi leads in human capital employed by its sovereign wealth funds, with 3,107 personnel across institutions, according to the report.
Other major cities, including Singapore, Riyadh, Kuala Lumpur and Dubai, follow closely, with each hiring more than 1,000 staff within their respective funds.
Globally, sovereign wealth funds managed US$12.5 trillion in assets. Six cities – Abu Dhabi, Oslo, Beijing, Singapore, Riyadh and Hong Kong – account for over two-thirds of this total.
“The world ranking confirms the concentration of sovereign wealth funds in a select number of cities, underscoring the significance of these financial hubs on the global stage,” said founder and managing director of Global SWF Diego Lopez. THE BUSINESS TIMES
 
Singapore passport is most desirable for money laundering, human trafficking, tax crimes.

Singapore tops ranking of world’s most powerful passports again​

Singaporeans enjoy visa-free entry to 195 out of 227 travel destinations.

Singaporeans enjoy visa-free entry to 195 out of 227 travel destinations.PHOTO: ST FILE
Vihanya Rakshika

Vihanya Rakshika
Jan 10, 2025

SINGAPORE - The Republic has clinched the top spot in a world ranking of passports again, with Singaporeans enjoying visa-free entry to 195 out of 227 travel destinations, according to the 2025 Henley Passport Index.

The index released two sets of rankings in 2024. In January 2024, Singapore shared the top spot with five other countries, but in July, it reclaimed the sole position as the world’s most powerful passport.

In the latest index released on Jan 8, Japan is ranked a close second, with its citizens having visa-free access to 193 destinations.

Finland, France, Germany, Italy, South Korea and Spain tie for third place with access to 192 destinations.

On the other end of the spectrum, the least powerful passports belong to Afghanistan, Syria and Iraq. Afghan passport holders can access only 26 destinations visa-free, while passport holders from Syria and Iraq are allowed visa-free entry to 27 and 31 destinations, respectively.

Meanwhile, China’s passport has made significant progress over the past decade, climbing from 94th place in 2015 to 60th place in 2025, with its citizens enjoying visa-free access to 40 more destinations.

In contrast, the US passport has fallen from second place in 2015 to its current ninth position on the index.

The Henley Passport Index evaluates the power of passports based on data from the International Air Transport Association and its own research.

It ranks countries based on the number of destinations their citizens can access without a visa, or where a visa on arrival, e-visa, or similar arrangement is available.
 

The 2023 crony-capitalism index​

War, tech woes and cock-ups have pummelled certain plutocrats​

20230506_IRD001.jpg

May 2nd 2023

Over the past 20 years, Britain’s capital was so welcoming to oligarchs that it became known as “Londongrad”. Many bought mansions from Highgate to Hyde Park; a couple bought into football clubs. After Russia invaded Ukraine in February last year, 48 oligarchs were placed under Western sanctions. The immense wealth of many of Vladimir Putin’s associates highlights the problem of crony capitalism and why more should be done to combat it.

20230506_IRC014.png

According to the latest instalment of our crony-capitalism index, which first estimated how much plutocrats profit from rent-seeking industries almost a decade ago, crony capitalists’ wealth has risen from $315bn, or 1% of global gdp, 25 years ago to $3trn or nearly 3% of global gdp now (see chart 1). Some 65% of the increase has come from America, China, India and Russia. Overall 40% of crony-capitalist wealth derives from autocratic countries and amounts to 9% of their gdp. There are hundreds of billionaires around the world whose riches are largely believed to derive from sectors which often feature chummy dealings with the state.

The way we estimate all this is to start with data from Forbes. The magazine has published an annual stock-take of the world’s wealthy for nearly four decades. In 1998 it reckoned that there were 209 billionaires with a total worth of $1trn, equivalent to 3% of global gdp. This year the publication details 2,640 billionaires worth $12trn or 12% of gdp. Most of those listed do not operate in rent-seeking sectors. Adjusting for rising prices—$1bn in 1998 is now equivalent to $3.3bn—there are 877 billionaires (at 1998 prices) with a collective worth of $9trn.

We classify the source of wealth into rent-seeking and non-rent-seeking sectors. An economic rent is the surplus remaining once capital and labour have been paid which, with perfect competition, tends towards zero. Rent-seeking is common in sectors close to the state, including banking, construction, property and natural resources. It can sometimes be possible for rent-seekers to inflate their earnings by gaining favourable access to land, licences and resources. They may form cartels to limit competition or lobby the government for cosy regulations. They may bend rules, but do not typically break them.

20230506_IRC015.png

Russia is, once again, the most crony-capitalist country in our index (see chart 2). Billionaire wealth from crony sectors amounts to 19% of gdp. The effects of the Ukrainian war are clear, however. Crony wealth declined from $456bn in 2021 to $387bn this year. Only one-fifth of Russian billionaires’ wealth is derived from non-crony sectors, which shows just how distorted the economy is.

In March last year, the g7, the eu and Australia launched the Russian Elites, Proxies and Oligarchs (repo) Task Force to “isolate and exert unprecedented pressure on sanctioned Russian individuals”. A year later it announced that it had blocked or frozen $58bn of assets. But repo admits that in some cases oligarchs have found it easy to evade sanctions by using shell companies, passing assets to family members or investing in property. Wealth is increasingly stored in manicured lawns and marble columns.

Pressure on the oligarchs comes from Russia, too. In March Mr Putin chastised them for becoming “dependent on foreign authorities” by hiding their assets offshore. Mr Putin is a hypocrite. By one estimate he has stolen more than $100bn from Russia—which has helped pay for a compound on the Black Sea estimated to cost $1.4bn and a $700m yacht impounded by the Italian authorities last year. But he is not on the Forbes billionaires’ list.

Our index illuminates other trends among the mega-wealthy. Many of America’s 735 billionaires have been hit by the crash in tech stocks last year; three-fifths of global tech-billionaire wealth originates there. The country’s nasdaq composite, a tech-tilted index, lost about a third of its value between November 2021 and December 2022. We reckon American tech billionaires saw their riches decline by 18%.

Overall crony-sector wealth amounts to around 2% of gdp in America, whereas non-crony-sector wealth is 15%. But tech exhibits some crony characteristics. America’s 20 biggest tech companies raked in half of all the industry’s sales in 2017, making it the country’s most concentrated sector. Tech firms are among the biggest lobbyists in Washington, with eight firms collectively spending $100m last year. Reclassify tech as a crony industry in our index and America’s crony wealth increases to 6% of gdp.

Meanwhile, Chinese billionaires continue to struggle with the vagaries of their government. Since Xi Jinping launched a crackdown on private capital, crony wealth has fallen sharply, from a peak of 4.4% of gdp in 2018 to 2.5% now. Tycoons of all stripes operate only with the consent of the state. In 1998 there were just eight billionaires in the country (including Hong Kong and Macau), with a total worth of $50bn. Now its 562 billionaires command $2trn.

By our measure crony capitalists account for about one-quarter of that total. A recent working paper published by the Stone Centre on Socio-Economic Inequality, part of the City University of New York, finds that between 83% and 91% of corrupt senior officials were in the top 1% of the urban income distribution because of their illegal incomes. Without that money, just 6% would be in that bracket.

Since Mr Xi came to power in 2012 over 1.5m people have been punished in an ongoing anti-corruption drive. High-profile tycoons also face more scrutiny. When Jack Ma, a co-founder of the tech giant Alibaba, disappeared in late 2020 after criticising the authorities, he was worth nearly $50bn. He recently re-emerged worth half of what he had been. Bao Fan, a billionaire banker, was whisked away in February to help with an investigation. He has not been seen since.

Official talk of “common prosperity” has created a cottage industry for getting money out of China. Singapore is a prime destination for it. In 2019 the country had just 33 Chinese family offices—firms which manage a family’s assets. There were perhaps 750 by the end of 2022.

India’s leader, Narendra Modi, has favourites among the country’s corporate captains. Over the past decade, wealth from crony-capitalist sectors has risen from 5% to nearly 8% of its gdp. Gautam Adani, the owner of the conglomerate of the same name, was briefly the world’s third-richest person in September. But in January his company was accused of fraud and stockmarket manipulation by Hindenburg Research, an American short-seller. It denies all accusations. His wealth has fallen from $90bn to $47bn.

Don’t take a slice of my pie​

What happens when cronyism gets completely out of control? If elites so enrich themselves that they impoverish a country, a “kleptocracy” forms, declared Stanislav Andreski, a Polish sociologist. He warned against such regimes and their effects in the late 1960s. It has taken more than 50 years for Western countries to heed him.

Identifying kleptocracy is more art than science. Our findings correlate only somewhat to indices of democracy and corruption. And in any case, at what level does corruption destroy the functions of the state? usaid, America’s agency for international development, issued an 84-page “dekleptification” guide last year. After studying 13 countries including Brazil, Malaysia and Ukraine, it recommends breaking up corrupt monopolies and digitising ownership registries, among other important measures.

America is also trying to whip up international fervour for a crackdown. In March it hosted its second “summit for democracy”. Seventy-four countries representing two-thirds of global gdp declared that, among other things, they would work to “prevent and combat corruption”. Russia and China were understandably missing. Brazil, Indonesia and South Africa were among those less understandably so.

At the summit Janet Yellen, America’s treasury secretary, pointed out that “kleptocrats launder kickbacks through anonymous purchases of foreign real estate”. So starting next year America will require firms formed or operating in the country to reveal their real, or “beneficial”, owners. Another 36 countries have signed up to America’s declaration to make concealing identity more difficult. But transparency is not a silver bullet. Last year a new law in Britain required foreign businesses that own property assets to register themselves and disclose their true owners. A report in February by an anti-corruption watchdog found that the owners of 52,000 of the 92,000 properties subject to the new rule remained undisclosed. Shady owners skirt rules and registries often lack the resources to police them.

America also frets about “golden” visas, which sell citizenship for a chunk of cash. Five Caribbean tax havens sell passports which provide visa-free travel to around 150 countries for $100,000-150,000 each. Britain’s tier-one visa scheme, launched in 2008, gave permanent residency within five years to foreigners who could prove they had £1m ($1.25m) to invest in British bonds or shares. It closed a week before the war in Ukraine started because of fears about Russian money (talk about closing the stable door once the thoroughbred has bolted). Of the 13,777 visas issued, a fifth went to Russians (including ten to oligarchs now under sanctions), a third to Chinese.

Back in London, a warning lies in Highgate cemetery. There you can find the grave of Alexander Litvinenko, not far from oligarch mansions (and also Karl Marx’s tomb). He was murdered in 2006 by Russian agents with a dose of polonium-210 after making lurid allegations about Mr Putin’s circle. Litvinenko is buried in a specially sealed lead-lined casket to prevent radiation leaking out. Now Western authorities need to prevent hazardous assets seeping into their countries. ■
 

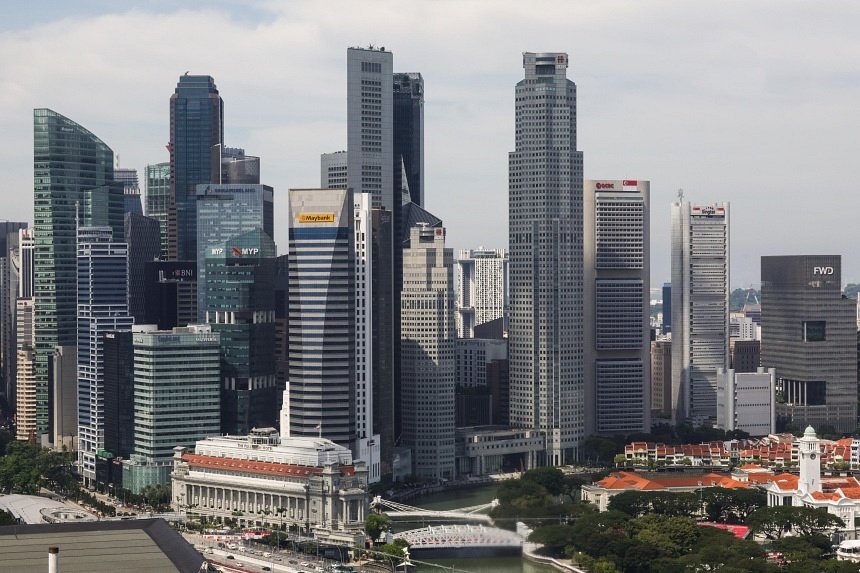
Singapore — the richest city with the most to lose​

Even as Singapore claims its place among the world’s wealthiest cities, a closer look reveals the uncomfortable cost of that ascent.

By Zat Astha / 24 Jul 2025
Senior folks walking along a HDB corridor, 12 Feb 2025. Tags: elderly, aging population, senior citizen, pioneer generation, super aged society, exercise, 年长者,老人化,老人,组屋,走廊

Opinion

Singapore is a city obsessed with metrics. Every few months, a new report — sometimes from a bank, sometimes from a consultancy, sometimes from the machinery of state itself — places Singapore somewhere near the top.​


Safest city. Most liveable city. Smartest city. The city with the world’s best airport, the most Instagrammable skyline, the most resilient in the face of global shocks.

Now, according to the latest global GDP rankings by The Economist, Singapore sits shoulder-to-shoulder with the world’s “richest” nations — top eight, depending on which calculation you favour, ahead of giants like the US, on par with Switzerland, Belgium, Norway, the Netherlands.

By all accounts, Singapore has arrived.

But statistics, like city skylines, are engineered to conceal as much as they reveal. “Richest” by what standard? GDP per person, at market exchange rates? Purchasing power, once you’ve stripped out the cost of living? Or, more subversively, GDP adjusted for the hours actually worked — an accounting for how much sweat, anxiety, and sacrifice is baked into every dollar?

Singapore excels at all three, but with each lens, the picture sharpens, then blurs. For every headline about prosperity, there is an undercurrent of apprehension, hinted at but rarely confronted directly.

This is not the complaint of a city that has fallen behind, but the growing unease of a society that has come perilously close to conflating contentment with mere survival.

What does it mean to be “rich” when satisfaction is paired, almost by reflex, with anxiety? What does it cost to remain at the summit — and who gets to pay that price?

A nation of achievers — but at what cost?​

Let’s start with the numbers. According to The Economist, Singapore ranks in the global top eight for GDP per capita, even when you factor in price differences and the total hours worked by each citizen. Norway, Qatar, Denmark, Belgium, Switzerland, the US, the Netherlands — these are our economic peers, the blue-chip cohort of the 21st century.


But then you turn to the Knight Frank-Ipsos Quality of Life Report 2025 — a thick, data-heavy document designed to answer, for once, not how much we produce, but how we actually live. The results are telling.

78ef0a1d1bc0d82e1c5468c96997262fba6c3f639ab50a7a4d1bca197050c360

Photo: Knight Frank-Ipsos
Seventy-five percent of Singaporeans say they’re satisfied with their housing. Fifty-six percent are satisfied with their jobs. Forty-nine percent are satisfied with their leisure options. On paper, this is what success looks like — an efficient, globally lauded, well-oiled machine.

Yet lurking beneath these percentages is a sharp, almost statistical irony: satisfaction and worry are now cohabitants.

8413a722643f8d3444f08e11d7858aee0c64cd71ad5783405222a4625c368a76

Photo: Knight Frank-Ipsos
Of those who report being satisfied with their housing, a full 65% also say they are worried — or at least “somewhat worried” — that they won’t be able to afford a home in the next three to five years. Only 13% are truly untroubled. The rest are whistling in the dark, hoping the cost curve bends before it breaks them.

In the realm of work, the gap between perception and experience widens.

6372ab909d917ca3c9b321b241c218d0985507893cc900b0096fa978fae36cb4

Photo: Knight Frank-Ipsos
Singaporean workers log more than 40 hours a week — often far more, according to the report. This is well above the averages in Germany, France, or the Netherlands.

Four out of ten Singaporeans experience work stress every week; one in five says it’s a daily visitor. And yet, the language of “satisfaction” persists.

Forty-five percent say they’re satisfied with their jobs, but just 11% reach for “extremely satisfied.” The rest are somewhere between stoicism and resignation, holding up the myth of balance in a country where, for many, the balance sheet is still written in hours and missed family dinners.

Leisure is no great escape, either. Asked about what they actually do for fun, Singaporeans rank dining out, shopping, and “leisure travel” highest — activities that are, for the most part, convenient, predictable, and safely commercial.

Only 8% put “Instagrammable activities” at the top.

Adventure and nightlife now trail far behind the search for value, convenience, and — most tellingly — scenic beauty and tranquility. When 69% of respondents name “ease of accessibility and convenience” as their number one recreational need, you begin to sense a culture of constant optimisation, not exuberance.

Engineered satisfaction, manufactured anxiety​

This is where the two stories — of statistical success and lived apprehension — collide.

It’s fashionable to say that Singaporeans are pragmatic, that we have learned to adapt, to make do, to cope. But “coping” is not a synonym for thriving. And “satisfied,” as the Knight Frank-Ipsos numbers show, is a term increasingly elastic — capable of stretching over anxiety, resignation, and the quiet fear of being left behind.

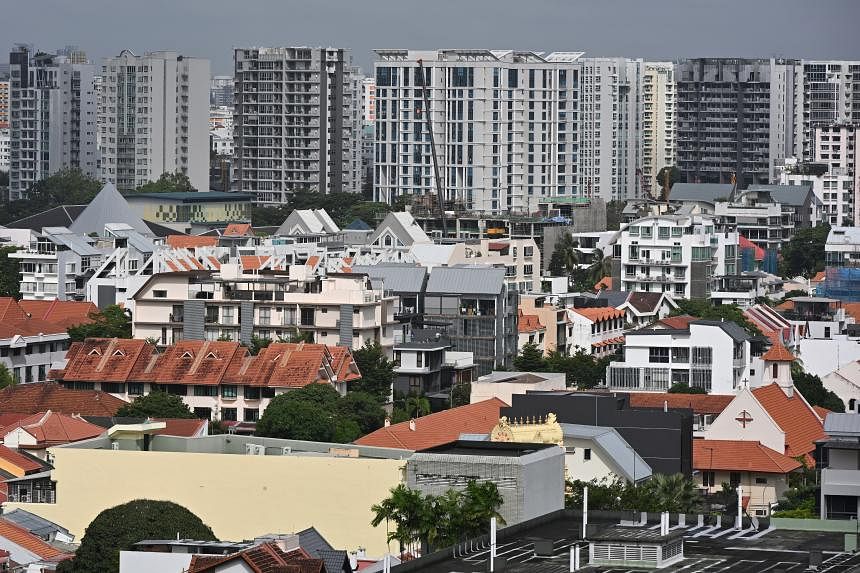
Singapore’s rise is often told as a parable of discipline, foresight, and engineering — both social and physical. We have remade swamps into world-class real estate; we have codified every facet of urban life, from hawker centres to hospitals to housing blocks.

But with that mastery has come an unexpected cost: a creeping normalisation of low-grade dread. The very systems designed to keep us safe — affordable housing, good jobs, convenient amenities — are now the sources of our deepest uncertainty.

The report’s authors do not shy from this. They note that rising costs permeate all aspects of life.

3fc650ebc95bd50bac2d9709f40d7bdb9e6fe9b7e66109dd6459fcd5134a21d7

Photo: Knight Frank-Ipsos
Fifty-two percent of respondents say this is their chief worry. Of those, housing is the epicentre. Thirty-five percent say they’re actively worried about being priced out in the near future; another 30% are “somewhat worried.”

In other words, two out of three Singaporeans face the future with a degree of trepidation that is entirely at odds with their city’s global reputation for stability.

00a22147c14634f1413273c13c986d4e7557187d6b9ade08655d4cebb4e92802

Photo: Knight Frank-Ipsos
Is it any wonder? New private home sales have pulled away from household incomes, with the price-to-income ratio for new homes spiking from 11.8 in 2019 to a staggering 18.9 in 2024.

Even HDB flats, long the backbone of Singapore’s social contract, have seen their price-to-income ratios creep back toward the highs of 2013, when affordability was a national debate.

The trade-offs are palpable. Thirty percent are willing to pay more for a better location and connectivity. Twenty percent will accept a longer commute for a larger, quieter home. Eighteen percent would take an older, more spacious flat over a new, compact one.

These are not the decisions of a population secure in its prosperity — they are the accommodations of a society bracing for volatility.

The mirage of the modern city​

And then there is work. The myth of Singaporean industriousness is alive and well. The reality, as the report notes, is more ambiguous.

Half the respondents work more than 40 hours a week, some well over 60. In other rich countries, this would be considered excessive, even abusive. Here, it is simply the price of admission.

The pandemic briefly rewrote the rules, introducing hybrid work and a flicker of hope for a gentler rhythm. But even now, only 28% of Singaporeans spend the bulk of their hours in the office; the rest float between home and workplace, negotiating new boundaries that are as likely to be violated as respected.

Related: SMEs dominate at NVPC’s Company of Good Ceremony in 2025
Forty-four percent prefer a structured hybrid model — two or three days in, two or three days out — a pattern now so entrenched that it may be Singapore’s new social contract.

But flexibility has its own discontents. Half the workforce reports weekly stress; 17% are stressed daily. The search for “work-life balance” is now the number one aspiration, cited by 79% — yet, in practice, it is an elusive promise. The pursuit of better ergonomic chairs, smarter offices, and wellness perks is, for many, a compensatory ritual. It is easier to install a nap pod than to grant a real lunch break; easier to tout mental health programs than to slow the pace.

The most telling statistic is this: only 11% of Singaporeans describe themselves as “extremely satisfied” with their jobs. The rest manage, adapt, persist — lucky to have a job, told to be grateful, always watching the cost of everything and the value of nothing.

A city that rarely lets go​

If Singapore’s work ethic is relentless, its approach to leisure is similarly circumscribed.

The city is packed with “recreational amenities” — malls, parks, food courts, gyms, event spaces. But the appetite for exuberance is remarkably muted.

Dining out, travel, and shopping top the list of leisure activities, a catalogue of enjoyment that is predictably safe and reliably convenient. Parks and nature make a strong showing — 52% include them in their top five activities, a testament to the growing hunger for respite in a city whose green plan is more celebrated than its wildness.

“Ease of accessibility and convenience” is king. “Scenic beauty and relaxing environment” follows. What’s missing is a taste for surprise, for chaos, for serendipity. Even as the city state aspires to be a “playground for the world,” its residents seem content to let others play more noisily.

This is not an accident, but the result of decades of social engineering. The city’s relentless drive for efficiency and order has left little space for the unruly, the unpredictable, the inconvenient.

The city delivers everything you need, but not always what you desire.

The case for messiness​

All of this raises a fundamental question, one that neither GDP statistics nor quality-of-life surveys can answer: At what point does the pursuit of prosperity begin to erode the foundations of contentment? When does the relentless chase for global “best-of” status stop producing more happiness and start generating more anxiety?

Singapore, at its heart, is a city that has always traded on its future. From independence, the promise was forward: tomorrow will be better, safer, richer, more secure. For decades, this was enough.

Today, as the city nears the outer limits of what can be engineered, a new mood is emerging — one that asks, “What now?”

Can a city be too efficient for its own good? Can a society so focused on stability begin to suffocate under the weight of its own anxieties?

Is it possible that, in becoming the “richest” city, Singapore has stumbled into a new kind of poverty — a poverty of imagination, of boldness, of risk?

The report offers few solutions, but it does issue a warning. Satisfaction, in the Singaporean context, is often indistinguishable from resignation. The willingness to adapt — to make do, to manage, to keep calm and carry on — is both a strength and a curse.

Toward a new ambition​

If there is hope, it lies in the willingness to acknowledge this tension. Singapore’s achievement is not in doubt; what remains is the task of reckoning with its consequences.

The next phase will require a different kind of ambition — one less interested in global rankings and more focused on the lived, daily experiences of its citizens.

This means grappling seriously with the anxieties around housing affordability, with the chronic stress of overwork, with the limits of engineered leisure. It means asking what kind of city Singapore wants to be when the next crisis hits — one that can absorb shocks not just with money, but with meaning.

It may require a loosening of the grip, a toleration for more mess, more debate, more irreverence. It will almost certainly require policy that is more supple, more empathetic, more open to experiment.

The richest city in the world is not the one that produces the most, or spends the most, or saves the most.

It is the one where people wake up — safe, unafraid, ambitious for more than survival — and recognise, in the faces of their neighbours and in the streets of their city, a life worth living.

Singapore is rich. The next challenge is to become whole.
 
Most dubious ish Simi covid resilience medal when excess deaths 9696 and usual suspects and shills still scared to update latest mRNA jabs lololololol
 

Singapore fourth most expensive city globally for expats, 28th for locals, study finds​

In Asia, Singapore was ranked the most expensive city to live in for both locals and expatriates, according to a survey of 45 cities.
Singapore fourth most expensive city globally for expats, 28th for locals, study finds

A view of the skyline in Singapore. (Photo: Reuters/Caroline Chia)


Ang Hwee Min

01 Sep 2025

SINGAPORE: Singapore is the fourth most expensive city for expatriates but 28th for locals, a study by researchers from the Lee Kuan Yew School of Public Policy has found.

The study, which looked at 45 cities across Asia, Australasia, Europe and North America, found that expatriate living costs are more directly influenced by global inflation dynamics and exchange rate fluctuations compared to the cost of living for locals.

Housing prices, transportation expenses and international school fees are the primary cost drivers for expatriates, the study found.

In 2025, Singapore placed fourth among the 45 cities surveyed for expatriate living costs, behind New York, Zurich and Los Angeles.

Singapore was the 28th most expensive city for locals, the study found.

For expatriates, the most expensive cities were mostly located in North America and Western Europe, except Singapore and Hong Kong. The Chinese city was ranked the 10th most expensive city for expatriates and 31st for locals.

In Asia alone, Singapore was the most expensive city for both expatriates and locals. Hong Kong came in second.

The study looked at these rankings from 2021 to 2025. Singapore was the sixth most expensive city globally for expatriates in 2021, and fifth from 2022 to 2024.

For locals, it placed 33rd in 2021, 30th in 2022, 29th in 2023 and stayed at 28th place in 2024 and 2025.

The study found that in higher-ranked cities such as Zurich, Singapore and Hong Kong, factors beyond regional economic development drove up living costs, with the top 10 also recording the highest housing prices.

Housing in Singapore was the sixth most expensive for expatriates among the 45 cities, but 23rd for locals.

Researchers attributed this to expatriates' heavier reliance on the private rental and condominium market, unlike locals who can access subsidised or public housing.

Transportation and education costs were also the highest globally for expatriates in Singapore, the study found, with car ownership cited as the most expensive due to the Certificate of Entitlement system.

The least expensive cities for expatriates were concentrated in Southeast Asia. Cities in developed regions generally have a higher cost of living and are becoming increasingly unaffordable, the researchers said.
 
Back
Top