The data shown below is quite misleading, as it state, excess death 2021-2024/25.
I assume it means the average of 2021-2024/25 = X , 35% increment of the pre covid 2019 number.
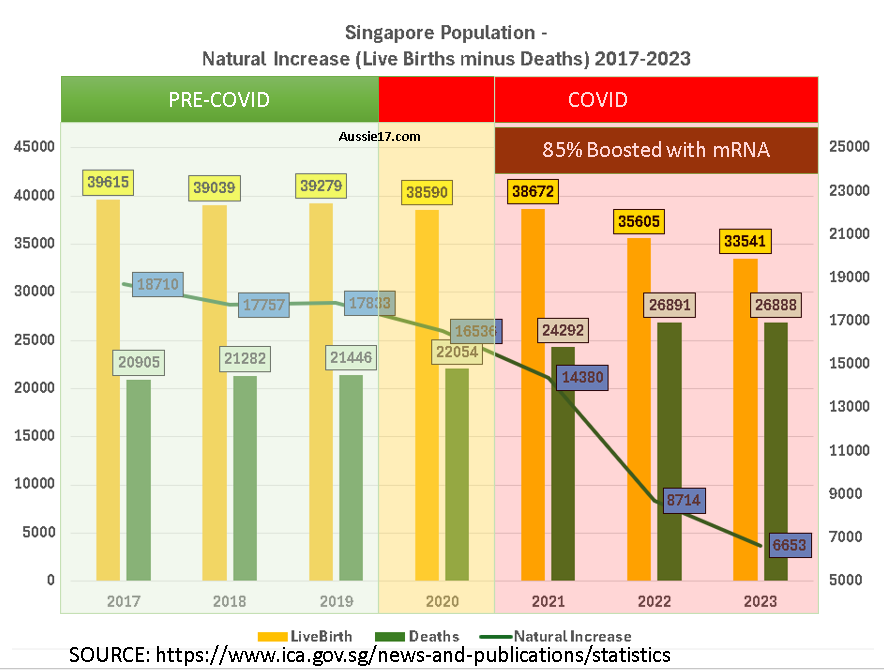
View attachment 227045
Let's break them down by per year basis, starting from 2019, to have a clearer picture. From AI
2019 = 21,446
Start counting the average from here,
2020 = 22,054
2021 = 24,292
2022 = 27,891
2023 = 26,891
2024 = 26,442
2025 = not available yet
X = 22054+24292+27891+26891+26442 =127,570
Average of X = 127,570/5 = 25,514
In 2019, it was 21,446
So there was an increased of 25,514 - 21,446 = 4,068
So it means 4,068/21,446= 0.189
Which means an increased of 18.9% excess death.
And not 35% as indicated.
Unless I had made a wrong assumption of the graph shown.