Not a shred of doubt: Sweden was right
 Eyal Shahar
6 days ago·6 min read
Eyal Shahar
6 days ago·6 min read
Counting the dead used to be the work of epidemiologists, statisticians and demographers. So was analyzing the numbers and drawing conclusions. In the past year many are counting deaths, but the numbers have no meaning without the context of a relevant time period, population and history. That is, epidemiology.
The most counted country is probably Sweden, a stubborn dissenter that refused lockdowns, mask mandates and contact tracing. By the time of this writing, 14,349 Swedes have reportedly died from the coronavirus. Has the Swedish model failed? Were the lockdowns justified? Were the economic and social upheavals in most of the world an unavoidable necessity?
The answer to all is a resounding no. The first (and not the only) witness: Sweden. To understand the testimony, we need to learn only two concepts: “flu year” and “excess mortality”.
“Flu year” versus calendar year
Many calculate mortality statistics according to the Gregorian calendar, but December 31st is not a meaningful end date for winter mortality in the northern hemisphere. The flu wave and the associated wave of mortality reach the peak at various dates, and sometimes secondary waves appear. Furthermore, the use of the Gregorian calendar combines the mortality in the first part of one winter (sometimes mild) with mortality in the second part of the previous winter (sometimes severe). There is no scientific justification for this grouping when analyzing historical trends.
The statistical alternative, which may be called “flu year”, contains a full winter season. Annual mortality is calculated from the beginning of the flu season, which is usually counted from week 40 (early October), till week 39 in the following year (end of September). Thus, the coronavirus waves in the spring and summer of 2020 belong to the 2019–2020 flu year, whereas the last winter wave belongs to the current flu year which will end in September.
Excess mortality
The concept of “excess mortality” is a little abstract. We need to compare actual mortality with “expected mortality”, but the latter is a theoretical idea that cannot be verified: what would the mortality in the 2019–2020 flu year have been, had there not been a pandemic? How do we calculate “expected mortality”?
One method uses a statistical model called linear regression. We fit a line to the mortality data from previous years, check its past performance, and use the continuation of the line to compute expected mortality. The distance between a data point of actual mortality and expected mortality on the line is excess mortality (or “mortality deficit”).
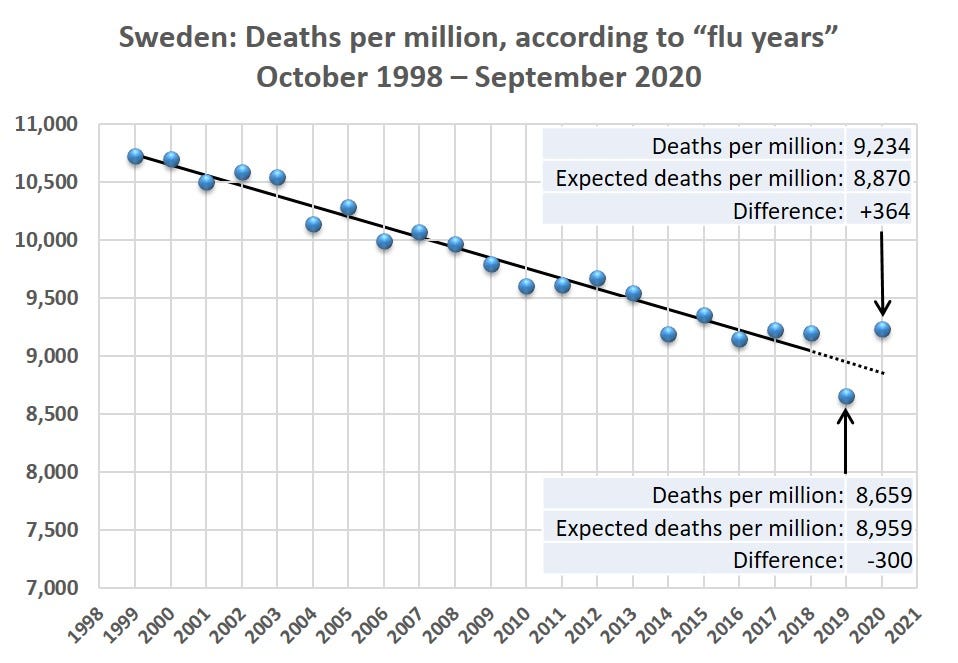
Mortality in Sweden by flu year
The graph shows the annual mortality in Sweden per million people in the last 22 flu years, where each flu year is labeled according to the calendar year in which it ends. For example, the last data point on the graph is mortality between October 2019 and September 2020: 9,234 per million people (95,365 deaths). To magnify, the vertical axis starts at 7,000.
Source: SCB.SE
It is easy to see that the points are located close to a straight line, until the flu year that ended in September 2018. The general downward trend reflects a consistent increase in life expectancy in Sweden for many years.
Experienced data analysts will attest that the fluctuations around the line are generally small and expected until 2018 (explained variation: 0.96). In contrast, both the flu year that preceded the pandemic (2018–2019) and the pandemic year (2019–2020) substantially deviate from the line: the former — in lower than expected mortality, and the latter — in higher than expected mortality.
Excess mortality in Sweden in flu year 2019–2020
Continuation of the line, which was fit by the statistical model, yields the following estimates: In 2018–2019 there was “mortality deficit” in Sweden of 300 per million people (-3.3%) whereas in 2019–2020, the pandemic year, there was excess mortality of 364 per million people (+4.1%). Excess mortality following mortality deficit, and vice versa, are well known and expected, as the main source of mortality is an elderly population with limited life expectancy. (The sequence “excess after deficit” is, of course, better than the reverse order.)
Assuming the excess mortality in 2019–2020 “fully balanced” the mortality deficit in the previous flu year, the true excess mortality in Sweden was less than 1% (about 700 deaths). And if we assume, absurdly, that the mortality in 2019–2020 was not affected at all by the mortality deficit in the previous flu year, then the excess mortality in Sweden did not exceed 4.1% (about 3,800 deaths). Excess mortality of a few percentage points, or more, has been calculated in many countries where life has been severely disrupted. Part of that excess has been attributed to lockdown and panic.
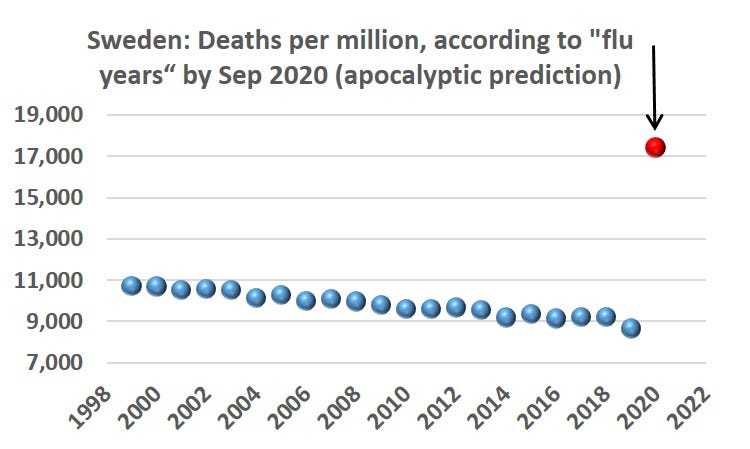
To remind us, the hysterical response to the pandemic was not due to fear of an excess annual mortality of 4% or even 10%. The apocalyptic forecasts, which caused the world to shut down, predicted about 90,000 deaths from the coronavirus in Sweden by the summer of 2020: 100% excess mortality! No wonder policy makers around the world prefer to forget those predictions.
Mortality in Sweden in the current flu year
The final summary of the current flu year (October 2020 — September 2021) will be known in the fall, but the data accumulated more than halfway through allow for interim conclusions. As many know, the coronavirus replaced the flu viruses this year, and there was no flu in Sweden, either. Nor were there apocalyptic predictions; only warnings about the number of accumulated deaths.
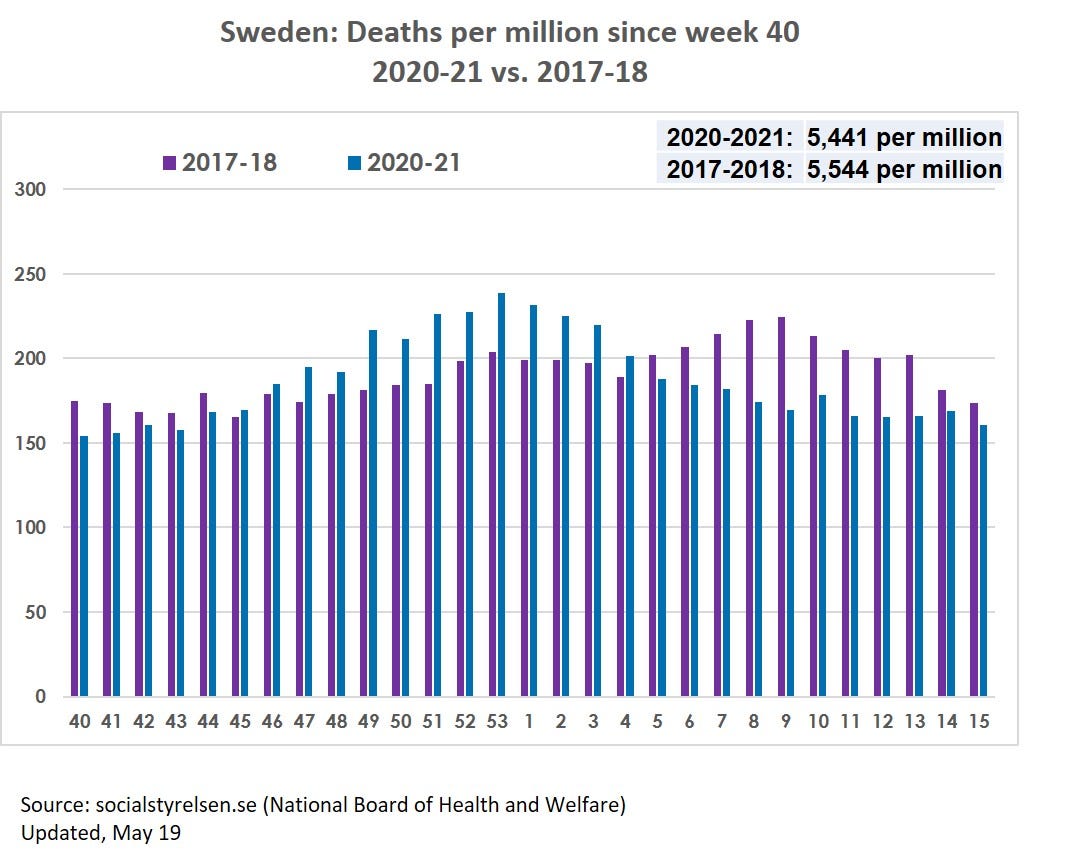
I chose to compare the mortality in Sweden in the current flu year (week 40, 2020 till week 15, 2021) to the corresponding mortality in 2017–2018. Two reasons for this choice: First, Europe experienced a severe flu season in that winter, which makes it an appropriate comparison. Second, although the flu season was severe in Sweden compared to previous years, it was still substantially milder than in Europe as a whole.
The graph shows a low mortality wave at the end of 2017 and a noticeable wave in February-March 2018 (another example of why a December 31st cutoff might distort historical trends). This winter, the mortality wave coincided with the coronavirus wave and its peak in late December. (In 2020 there were 53 weeks, so the dates do not exactly match.) A secondary coronavirus wave, which appeared in mid-February, half way through the decline of the former, did not result in a secondary mortality wave.
The all-cause death toll in Sweden in the first 29 weeks of the current flu year is 56,452 (5,441 per million people) compared to 55,967 (5,544 per million people) in the same period in 2017–2018. In that winter, the excess mortality rate in Europe attributed to the flu was at least twice as high as in Sweden.
Sweden proved right in the retest.
A colossal mistake
The pandemic has taken its death toll, ranging from large to small in different countries and within countries, and mostly affected the frail elderly. But the lockdowns and panic were unsubstantiated, prevented nothing, and caused indescribable damage to society. Sweden’s statistics tell us, unequivocally, that in much of the world lives have been lost and livelihoods have been destroyed — in vain.
Will anyone, in any country, be held accountable?