
- Joined
- Jul 19, 2011
- Messages
- 28,311
- Points
- 113
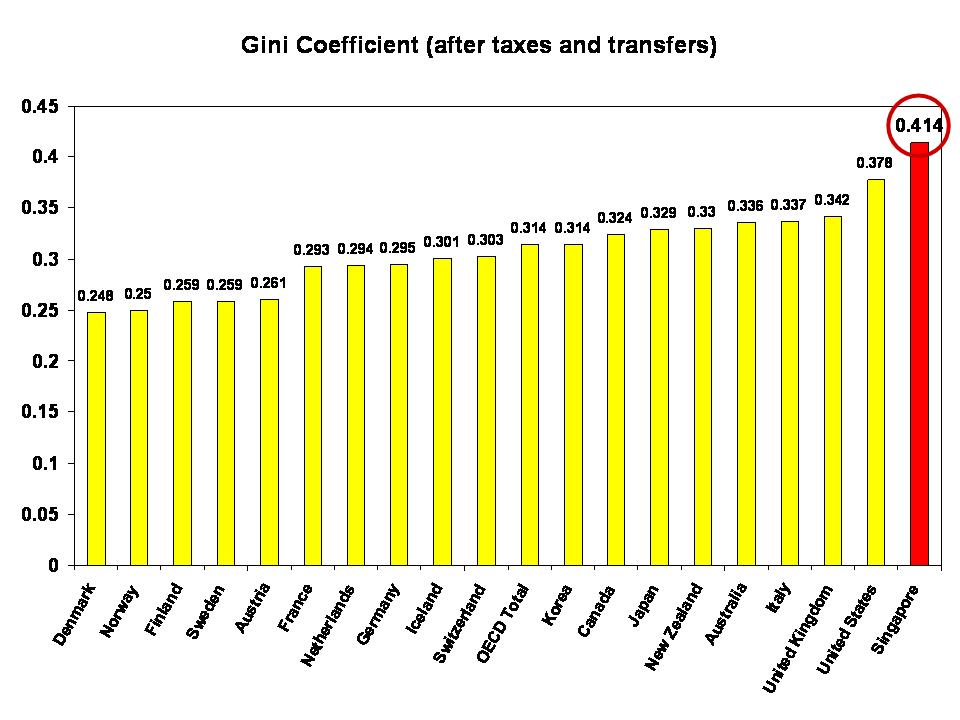
Income inequality here at its lowest\
Most households here earned more last year, with incomes rising amid a tight labour market and government help for low-wage workers. The exception was the richest households, which saw their incomes fall. This resulted in the income gap narrowing, with the Gini coefficient - a widely used measure of income equality - showing the lowest inequality since 2004.
With the effect from various government taxes, handouts and subsidies factored in, it was the lowest on record. This was according to a Department of Statistics report on Feb 18, which covered households headed by Singapore citizens or permanent residents, and with at least one working person.
Median monthly household income from work rose to $7,872, meaning that half of households earned at least that much. This was up 4 per cent from 2012, or 1.6 per cent after accounting for inflation.
Taking household size into account, the gains were greater. Median income per household member went up 5.6 per cent, or 3.2 per cent after inflation. Income gains were across the board - except at the very top. In the top one-tenth, average income per household member fell by 5.2 per cent in real terms.
Economists said high-income earners tend to have larger variable pay components, meaning bigger annual fluctuations.
Bonuses last year would have been smaller owing to 2012's weak economic performance, said Barclay's economist Joey Chew.
Apart from the top 10 per cent, all other groups saw household incomes rise both before and after accounting for inflation.
 wu niar bo